Regression
Regression with the Enron Corpus
Enron was one of the largest US companies in 2000. At the end of 2001, it had collapsed into bankruptcy due to widespread corporate fraud, known since as the Enron scandal. A vast amount of confidential information including thousands of emails and financial data was made public after Federal investigation.
In this project, I will use linear regression to try to predict financial data for Enron employees and associates.
-
We first need to download the Enron Corpus (this might take a while, like more than an hour) and unzip the file (which can take a while too). There is 156 people in this dataset each one identified by their last name and the first letter of their first name.
-
Let's take a look at the data. The dataset for the project can be read as a dictionary where each key is a person and its value is a dictionnary containing all the possible feature. Here is an example of one of the entry :
{'ALLEN PHILLIP K': {'bonus': 4175000, 'deferral_payments': 2869717, 'deferred_income': -3081055, 'director_fees': 'NaN', 'email_address': 'phillip.allen@enron.com', 'exercised_stock_options': 1729541, 'expenses': 13868, 'from_messages': 2195, 'from_poi_to_this_person': 47, 'from_this_person_to_poi': 65, 'loan_advances': 'NaN', 'long_term_incentive': 304805, 'other': 152, 'poi': False, 'restricted_stock': 126027, 'restricted_stock_deferred': -126027, 'salary': 201955, 'shared_receipt_with_poi': 1407, 'to_messages': 2902, 'total_payments': 4484442, 'total_stock_value': 1729541} } -
Let's see if there is any correlation between the features "salary" and "bonus". Training-testing sets are needed in regression to make predictions. We therefore need to split our data into training and testing sets.
### Modified from: Udacity - Intro to Machine Learning

import pickle
from feature_format import featureFormat, targetFeatureSplit
from sklearn.model_selection import train_test_split

##########################################################################
### Split data

### A pickle document was created by the instructors of the course.
### To find it, see the full project on github
dictionary = pickle.load( open("../final_project/final_project_dataset_modified.pkl", "r") )

### Create a list with first the target feature ("bonus")
### and second the input feature ("salary")
features_list = ["bonus", "salary"]

### FeatureFormat converts data from the dictionary format to an
### (n x k) python list that's ready for training an sklearn algorithm
data = featureFormat(dictionary, features_list, remove_any_zeroes=True)

### targetFeatureSplit separates out the first feature (should be the target)
### from the others. The function returns targets in in its own list
### and all of the other features in a separate list
target, features = targetFeatureSplit(data)

### train_test_split splits the data into training and testing sets
feature_train, feature_test, target_train, target_test = \
    train_test_split(features, target, test_size=0.5, random_state=42)

##########################################################################
### Draw the scatterplot
for feature, target in zip(feature_test, target_test):
    plt.scatter( feature, target, color='r' )
for feature, target in zip(feature_train, target_train):
    plt.scatter( feature, target, color=train_color )

### Add labels
plt.scatter(feature_test[0], target_test[0], color='r', label="Test")
plt.scatter(feature_train[0], target_train[0], color='b', label="Train")

### Add axis labels
plt.xlabel(features_list[1])
plt.ylabel(features_list[0])

### Add legend
lgd = plt.legend(bbox_to_anchor=(0, 1.02, 1, 0.102), loc=3, ncol=2)
plt.savefig("figure.png", bbox_extra_artists=(lgd,), bbox_inches='tight')
plt.show()
Once plotted we can see the repartition of the people and their bonus with respect to their salary.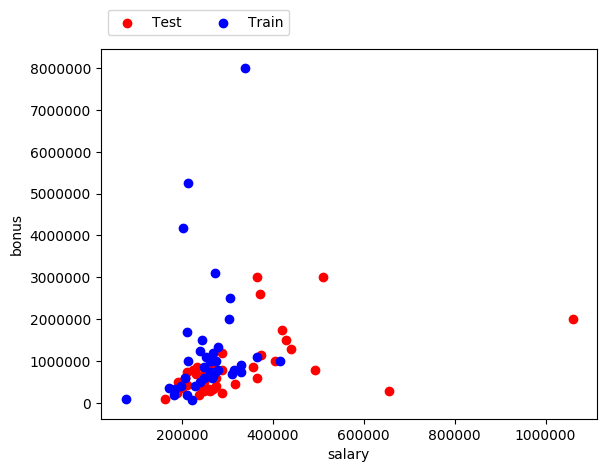
-
We can now draw the regression and try to predict the bonus (target feature) of a person with its salary (input feature). We'll use the class sklearn.linear_model.LinearRegression().
### Modified from: Udacity - Intro to Machine Learning

from sklearn import linear_model

regression = linear_model.LinearRegression()

### Fitting linear model on the training set
reg = regression.fit(feature_train, target_train)
slope = reg.coef_
intercept = reg.intercept_

### Prediction on the test set for each input.
### Returns a list of all bonuses predicted for
### each salary in the feature_test
prediction = reg.predict(feature_test)

### Returns the coefficient of determination R^2 of the prediction
accuracy = reg.score(feature_test, target_test)

### Add the regression to the plot
plt.plot(feature_test, reg.predict(feature_test))
Parameters calculated :
- Slope = 5.44814029
- Intercept = -102360.543294
- Regression score = -1.4849924173685092
Considering that the best possible regression score is 1.0, the score we get with the "bonus" and "salary" features is pretty bad. This means that "salary" is not a good feature to predict the target feature "bonus" in this dataset.
Let's look at other features that might be correlated with the "bonus" feature like the "long_term_incentive" feature.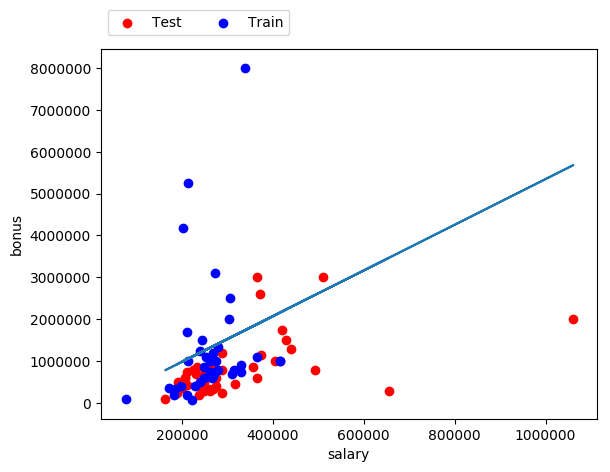
Linear regression on the training set
target feature = "bonus", input feature = "salary"
-
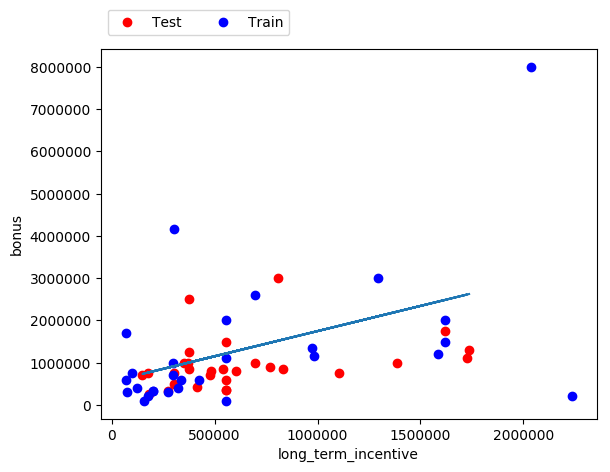
Here is the plot for the prediction of "bonus" with the "long_term_incentive" feature as input.
Parameters calculated :
- Slope = 1.19214699
- Intercept = 554478.756215
- Regression score = -0.59271289994986409
Here the regression score is better which shows that the "long_term_incentive" feature is better at predicting the "bonus" of a person than the "salary" feature in this dataset.
Linear regression on the training set
target feature = "bonus", input feature = "long_term_incentive"